Taking a look at these candle patterns, it can certainly give you a short term idea of where the market is going. It would be a good idea to use momentum indicators as these can help to add more value to what the chart is telling you. If the gap happens when the indicator is in an over bought or over sold position, it could potentially signal a reverse, even though this particular pattern does not signal an overall trend change. Be sure to take this and apply it to a demo account first, and if you have any questions, reach out to the investing community and they can help to clarify any issues.
Upside-and-Downside-Gap-Three-Methods
| By Nathan Young | Macroaxis Story |
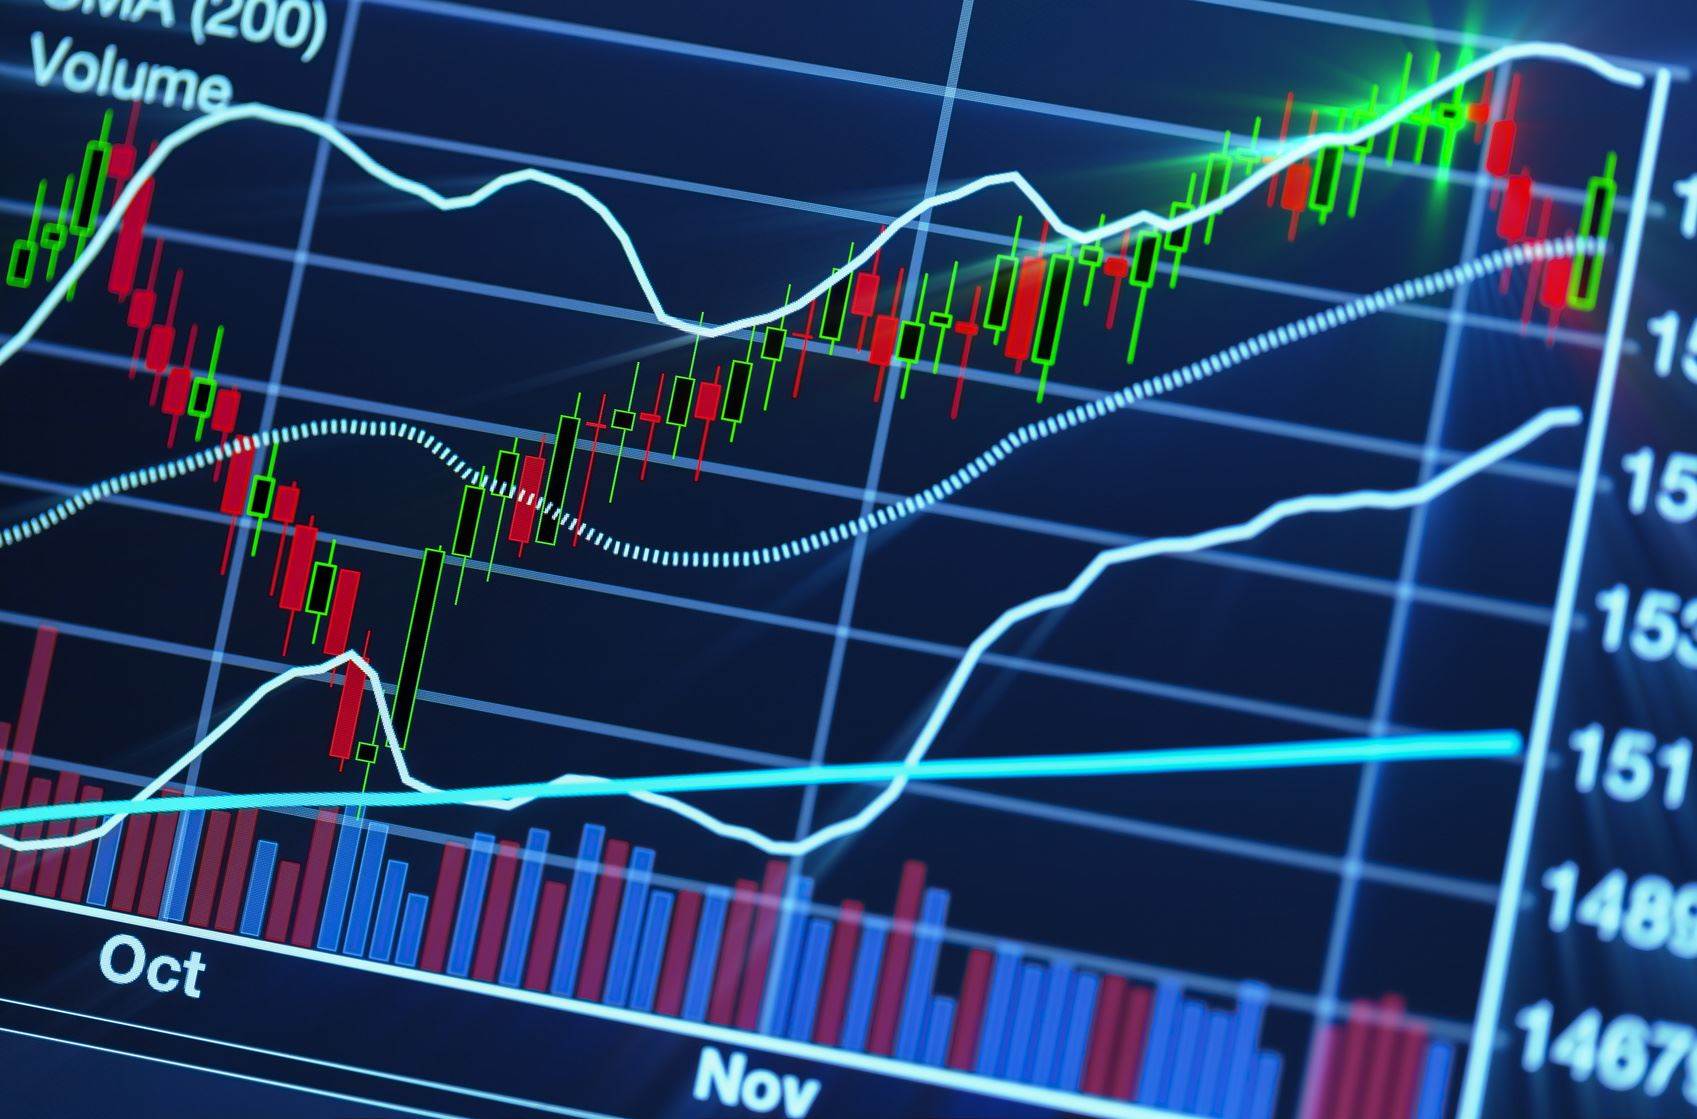
If you have been using candle stick pattern trading, then you have probably hear of the gap three method, which can work to the upside or downside. The gap three method to the upside happens when there is a strong uptrend. The gap happens to the first candle to the second, and then the third candle fills the gap. A reason that this occurs could be that people are simply taking profits from the gap up, but it may alter the long term up trend.
Updated over a year ago View currently updated edicational stories | Filter Upside and Downside Gap Three Methods |
Macroaxis uses a strict editorial review process to publish stories and blog posts. Our publishers support our company and may receive a small commission when the partner links or references are utilized. Commissions do not affect the opinions or evaluations of our editorial team. The information our editors and media partners deliver is confidential and licensed for your sole use as a Macroaxis user. We reserve all rights to the content of this article, and therefore copying or distributing this story in whole or in part is strictly prohibited.
Reviewed by Raphi Shpitalnik
Similar to the upside, you can take this to the down side, which the gap fill would indicate short sellers are taking their profits on the gap, but may not alter the overall trend. Candle patterns are regularly used in day trading and long term investing, but they do not always generate reliable indications.
Building efficient market-beating portfolios requires time, education, and a lot of computing power!
The Portfolio Architect is an AI-driven system that provides multiple benefits to our users by leveraging cutting-edge machine learning algorithms, statistical analysis, and predictive modeling to automate the process of asset selection and portfolio construction, saving time and reducing human error for individual and institutional investors.
Try AI Portfolio ArchitectEditorial Staff
This story should be regarded as informational only and should not be considered a solicitation to sell or buy any financial products. Macroaxis does not express any opinion as to the present or future value of any investments referred to in this post. This post may not be reproduced without the consent of Macroaxis LLC. Please refer to our Terms of Use for any information regarding our disclosure principles.
Would you like to provide feedback on the content of this article?
You can get in touch with us directly or send us a quick note via email to editors@macroaxis.comDid you try this?
Run Latest Portfolios Now
Latest PortfoliosQuick portfolio dashboard that showcases your latest portfolios |
| All Next | Launch Module |
Check out Investing Opportunities to better understand how to build diversified portfolios. Also, note that the market value of any private could be tightly coupled with the direction of predictive economic indicators such as signals in estimate. You can also try the Portfolio Rebalancing module to analyze risk-adjusted returns against different time horizons to find asset-allocation targets.
Other Consideration for investing
| Price Ceiling Movement Calculate and plot Price Ceiling Movement for different equity instruments | |
| Watchlist Optimization Optimize watchlists to build efficient portfolios or rebalance existing positions based on the mean-variance optimization algorithm | |
| Companies Directory Evaluate performance of over 100,000 Stocks, Funds, and ETFs against different fundamentals | |
| Bollinger Bands Use Bollinger Bands indicator to analyze target price for a given investing horizon | |
| Instant Ratings Determine any equity ratings based on digital recommendations. Macroaxis instant equity ratings are based on combination of fundamental analysis and risk-adjusted market performance | |
| Content Syndication Quickly integrate customizable finance content to your own investment portal | |
| Latest Portfolios Quick portfolio dashboard that showcases your latest portfolios | |
| Earnings Calls Check upcoming earnings announcements updated hourly across public exchanges | |
| Sign In To Macroaxis Sign in to explore Macroaxis' wealth optimization platform and fintech modules | |
| Portfolio File Import Quickly import all of your third-party portfolios from your local drive in csv format | |
| Piotroski F Score Get Piotroski F Score based on the binary analysis strategy of nine different fundamentals | |
| Price Transformation Use Price Transformation models to analyze the depth of different equity instruments across global markets | |
| Price Exposure Probability Analyze equity upside and downside potential for a given time horizon across multiple markets |