You could also use the trend with Bollinger Bands or standard deviation because as the chart approaches one or two standard deviation, you would be anticipating the chart to slow its current trend and potentially reverse slightly. As with any new tool, take a test run on a demo account and get familiar with it. The linear regression slope tool can certainly give you an edge in your investing, but it conversely may not fit your trading and investing styles. For added information, sync it with a momentum indicator and see if that gives you a sweet spot for identifying potential chart changes.
Linear-Regression-Slope
| By Nathan Young | Macroaxis Story |
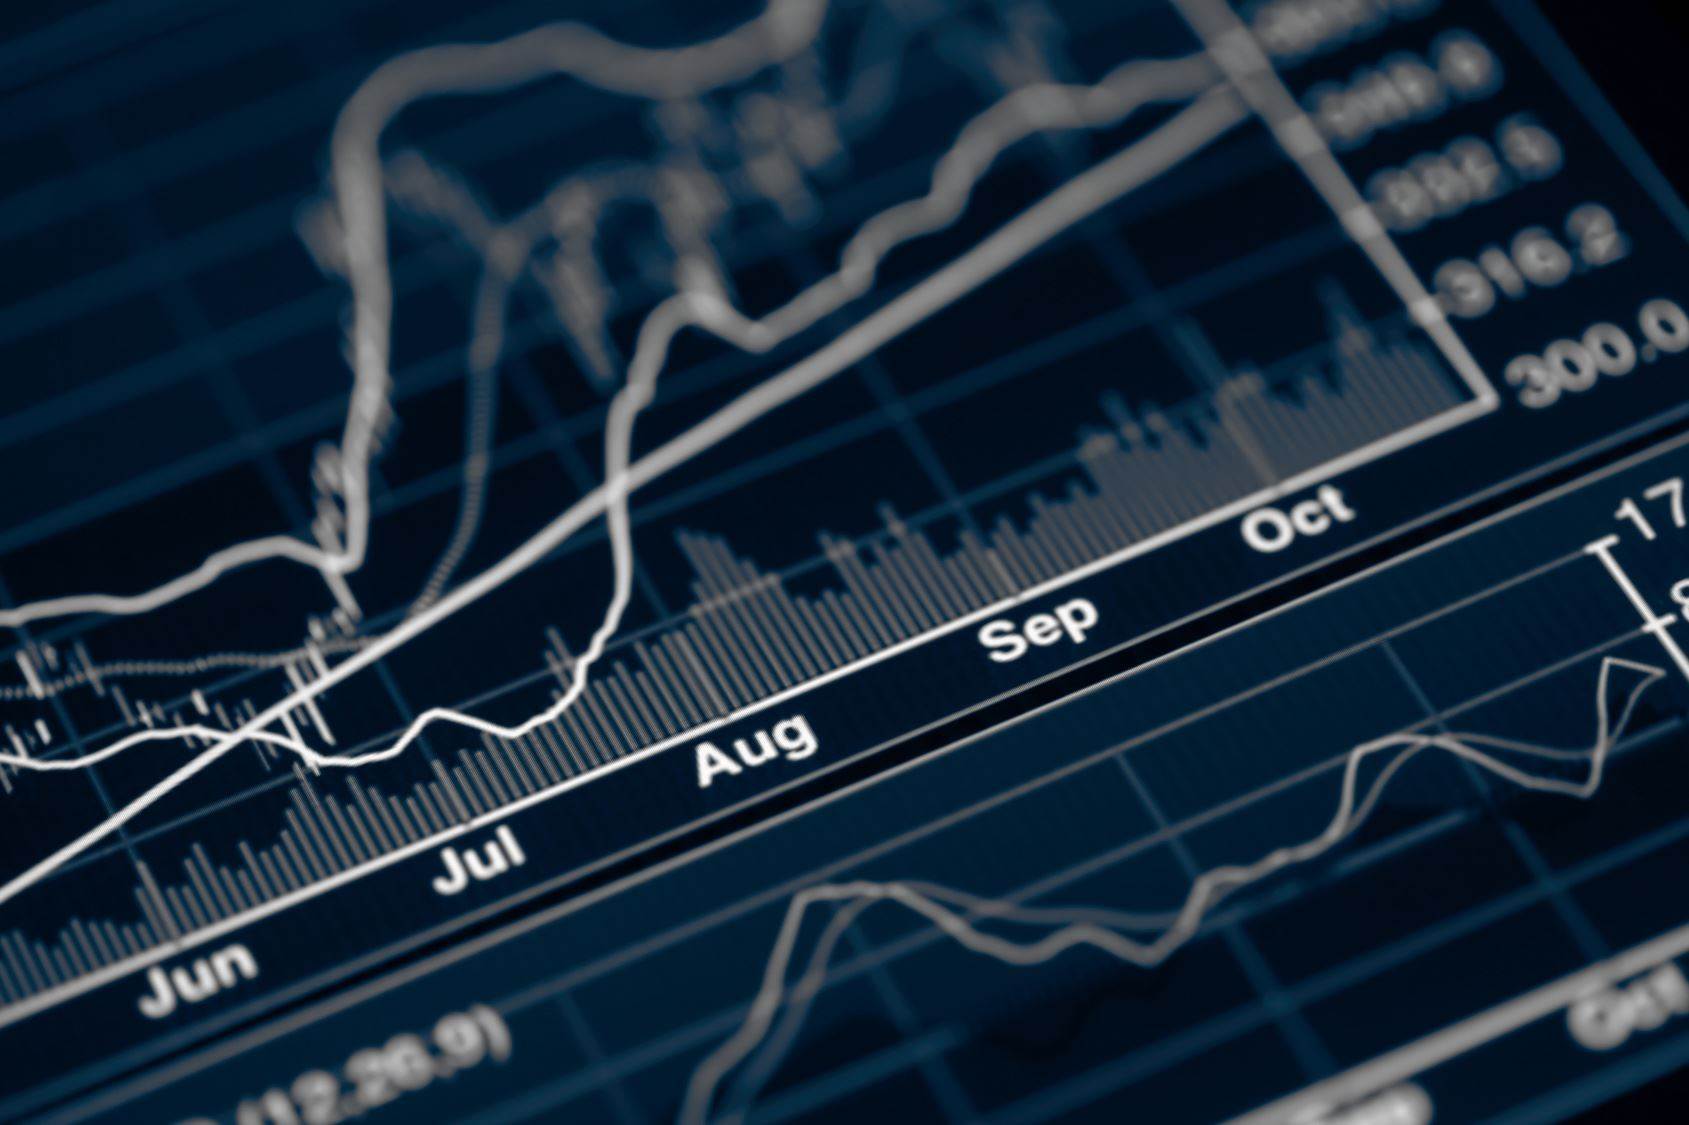
When looking at a chart, there are many different ways to evaluate your options, and the linear regression slope can help you indicate the current trend of the chart. The data is plotted as a line and fluctuates between positive and negative numbers, indicating where the trend currently lies. If the line is in positive territory, that would indicate the market is in an upward trend and if the line is in negative territory, that indicates the market is a bear and trending downward. This tool may resemble momentum tools and can certainly be used in conjunction with those tools.
Updated over a year ago View currently updated edicational stories | Filter Linear Regression Slope |
Macroaxis uses a strict editorial review process to publish stories and blog posts. Our publishers support our company and may receive a small commission when the partner links or references are utilized. Commissions do not affect the opinions or evaluations of our editorial team. The information our editors and media partners deliver is confidential and licensed for your sole use as a Macroaxis user. We reserve all rights to the content of this article, and therefore copying or distributing this story in whole or in part is strictly prohibited.
Reviewed by Gabriel Shpitalnik
How to use this is you can use it on its own to indicate where the current trend of the chart is at. Another way to go about using this data point is to populate your chart with a momentum indicator because when you look at the regression slope, that will be giving you the trend direction and in conjunction with a momentum chart, that will also give you data on how much there is backing the upward or downward trend. Of course you set the tools to match your trading and investing time frame.
Building efficient market-beating portfolios requires time, education, and a lot of computing power!
The Portfolio Architect is an AI-driven system that provides multiple benefits to our users by leveraging cutting-edge machine learning algorithms, statistical analysis, and predictive modeling to automate the process of asset selection and portfolio construction, saving time and reducing human error for individual and institutional investors.
Try AI Portfolio ArchitectEditorial Staff
This story should be regarded as informational only and should not be considered a solicitation to sell or buy any financial products. Macroaxis does not express any opinion as to the present or future value of any investments referred to in this post. This post may not be reproduced without the consent of Macroaxis LLC. Please refer to our Terms of Use for any information regarding our disclosure principles.
Would you like to provide feedback on the content of this article?
You can get in touch with us directly or send us a quick note via email to editors@macroaxis.comDid you try this?
Run Earnings Calls Now
Earnings CallsCheck upcoming earnings announcements updated hourly across public exchanges |
| All Next | Launch Module |
Check out Investing Opportunities to better understand how to build diversified portfolios. Also, note that the market value of any private could be tightly coupled with the direction of predictive economic indicators such as signals in estimate. You can also try the Financial Widgets module to easily integrated Macroaxis content with over 30 different plug-and-play financial widgets.
Other Consideration for investing
| Technical Analysis Check basic technical indicators and analysis based on most latest market data | |
| Content Syndication Quickly integrate customizable finance content to your own investment portal | |
| Pair Correlation Compare performance and examine fundamental relationship between any two equity instruments | |
| Portfolio Holdings Check your current holdings and cash postion to detemine if your portfolio needs rebalancing | |
| Cryptocurrency Center Build and monitor diversified portfolio of extremely risky digital assets and cryptocurrency |