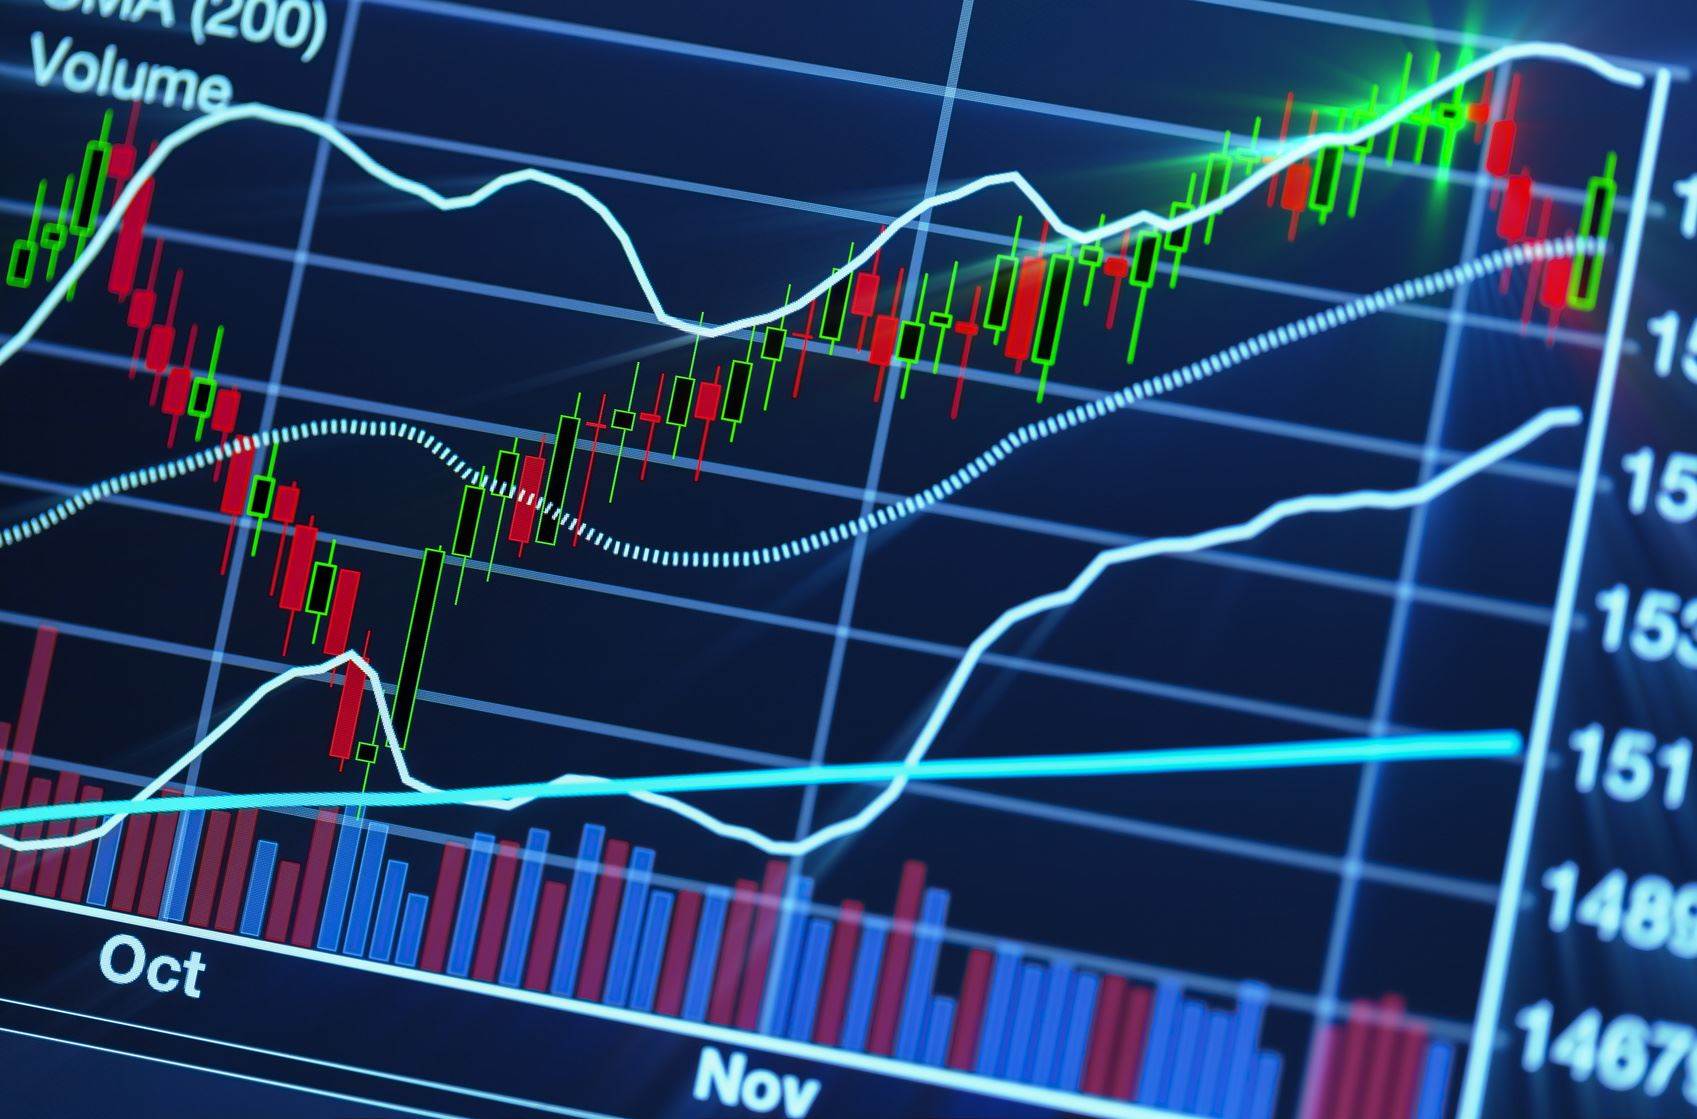
First, you have to establish that there is a downtrend in the market, with candles that have been bearish for consecutive periods. Once you’ve established that the market is in a down trend, you will then want to watch for a bearish candle that gaps up and closes high above the last bear candle, indicating there may be a trend change. This simply put is the ladder bottom you might want to watch for.

One characteristic to watch for is the last bearish candle should have a high upper shadow, indicating the market attempted to push the chart higher and the bulls are present. Another aspect to watch would be volume, you want to see how many people participated in that particular candle and then when the bullish candle hits, you want to ensure there are enough people behind the push higher.
Of course you have to ensure that all the criteria are met, which include several bearish candles that include large downward bodies, the candle preceding the bullish candle with the long upper shadow, and then the bullish candle that gaps up and pushed the market higher.
Keep in mind that technical indicators are not full proof, but rather a way to potentially spot a change in the chart. Knowing what a chart may change is key because you can then hone in on what is important and begin to analyze a position. These types of technical formations are great to use with fundamental analysis because the technical side does not take into account many of the numbers and health of the company.
Search the Internet and figure out how other people are using this and see if you can adapt it to your current trading style. Consult with an investing community and see what they think or if they are using it in the current market. Test it on a demo account until you feel confident or decide that this type of analysis is not for you. Either way, you will have learned something new and worthwhile and it will reside in your toolbox going forward. Again, this is a great tool to use to find a bearish trend reversing into a potential bull trend.
Building efficient market-beating portfolios requires time, education, and a lot of computing power!
The Portfolio Architect is an AI-driven system that provides multiple benefits to our users by leveraging cutting-edge machine learning algorithms, statistical analysis, and predictive modeling to automate the process of asset selection and portfolio construction, saving time and reducing human error for individual and institutional investors.
Try AI Portfolio ArchitectEditorial Staff
Nathan Young is a Senior Member of Macroaxis Editorial Board - US Equity Analysis. With years of experience in the financial sector, Nathan brings a diverse base of knowledge. Specifically, he has in-depth understanding of application of technical and fundamental analysis across different equity instruments. Utilizing SEC filings and technical indicators, Nathan provides a reputable analysis of companies trading in the United States.
View Profile This story should be regarded as informational only and should not be considered a solicitation to sell or buy any financial products. Macroaxis does not express any opinion as to the present or future value of any investments referred to in this post. This post may not be reproduced without the consent of Macroaxis LLC. Please refer to our
Terms of Use for any information regarding our disclosure principles.
Would you like to provide feedback on the content of this article?
You can get in touch with us directly or send us a quick note via email to
editors@macroaxis.com