Before adding and committing to a new charting tool, take a look at the tool on a demo account and understand how it works. Be sure to set the data points accordingly and test it out with your current investing or trading strategy. There are many different momentum indicators out there so take a look at many and then settle on one or none. Consulting a forum or completing more research will certainly help you learn and find ways to maximize these tools.
Momentum
| By Nathan Young | Macroaxis Story |
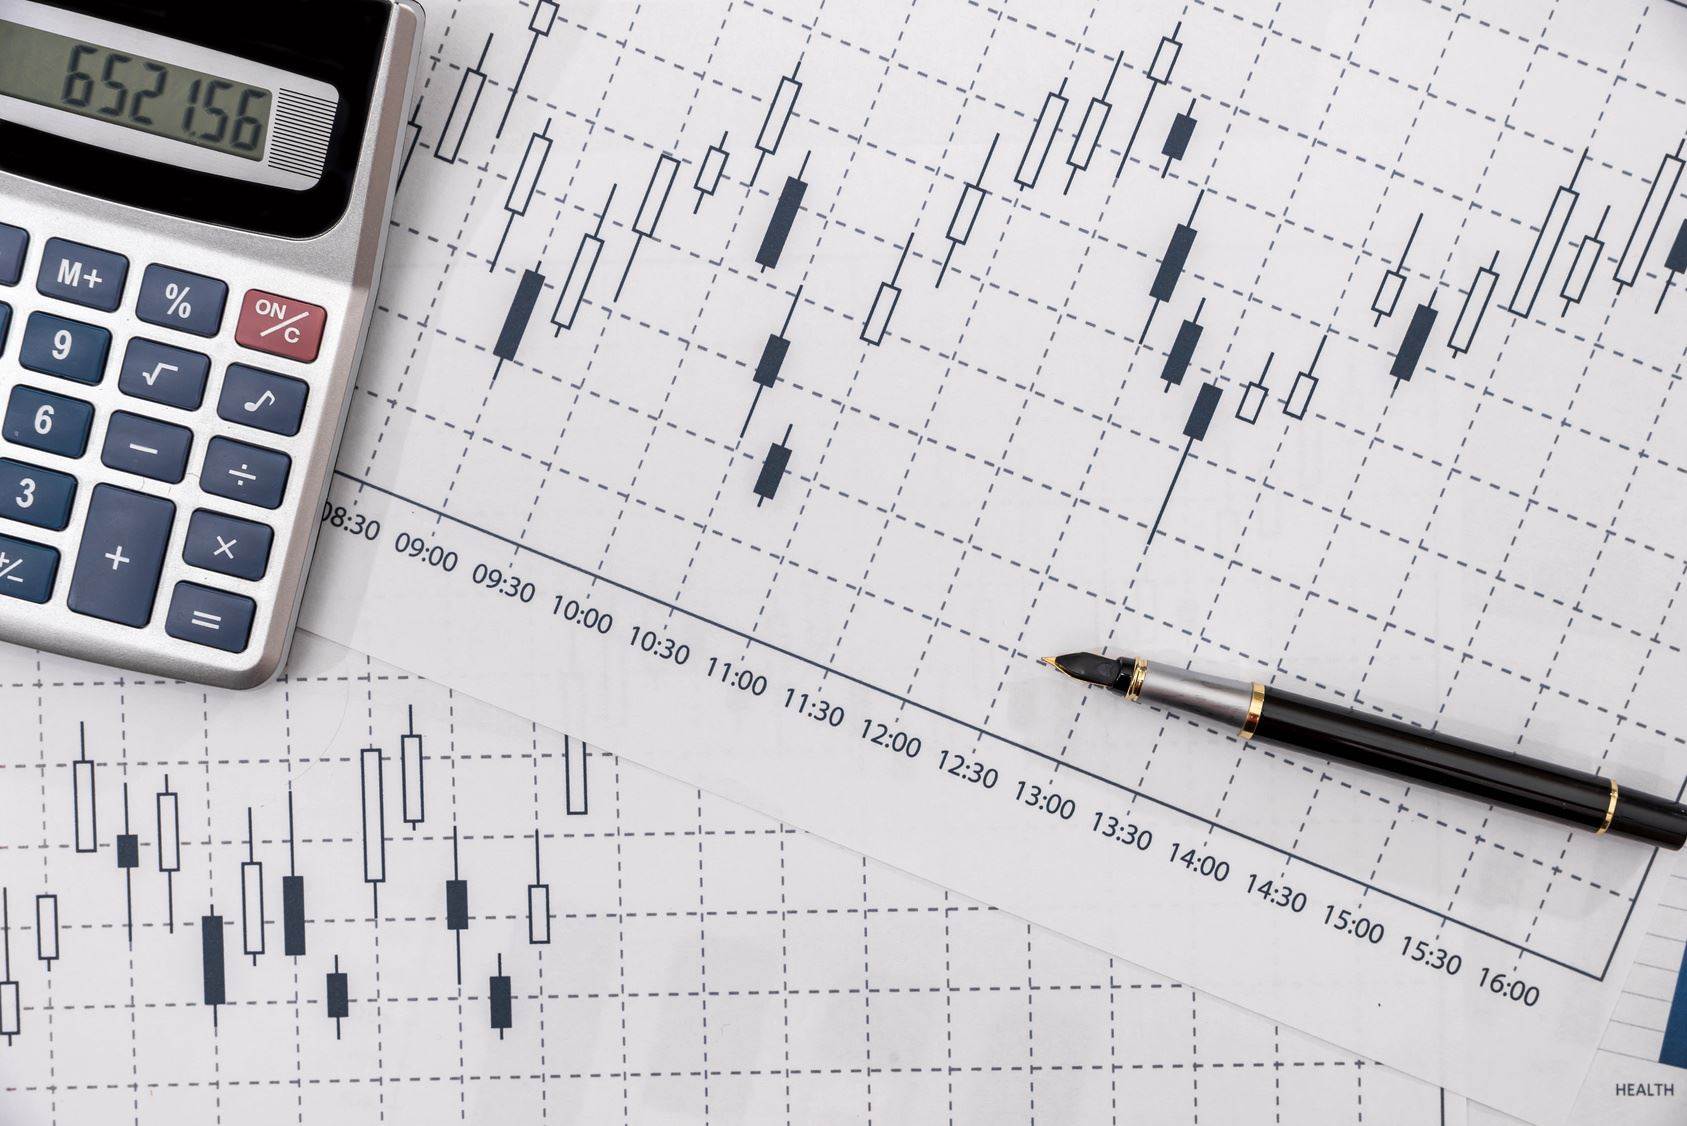
When you look at a chart, you simply see candles or a line chart that gives you data points on price of the stock for your chosen time frame. The information alone is very limited in what it can tell the viewer. People see stock go up, down, and sideways, but they are limited as what the behind the scenes are stating. Momentum is a data point that can really put some perspective on a chart and allow you to get a better painted picture of what the equity can do. Momentum simply tells you how much buying or selling pressures are behind a move and how much volume is there.
Updated over a year ago View currently updated edicational stories | Filter Momentum |
Macroaxis uses a strict editorial review process to publish stories and blog posts. Our publishers support our company and may receive a small commission when the partner links or references are utilized. Commissions do not affect the opinions or evaluations of our editorial team. The information our editors and media partners deliver is confidential and licensed for your sole use as a Macroaxis user. We reserve all rights to the content of this article, and therefore copying or distributing this story in whole or in part is strictly prohibited.
Reviewed by Gabriel Shpitalnik
First, let us use an example of the equity of your choosing, and it is going to the upside. When the chart alone is presented, all you see is a stock increasing with no context. You have no idea how much farther the stock may go or what is driving the movement or how many people are driving the movement. When you add in momentum, you can really get a sense of how much further the stock may have to run or if it is running on low momentum which could indicate a pull back soon. The same idea can be applied to a stock that is selling off.
When you check out a chart, there are many different momentum indicators that allow you to gauge momentum and see where the price is going. They are customizable and allow you to encompass a various amount of time ranges and data points. Usually they run from 0 to 100 and anything below 20 means the stock is potentially oversold and anything above 80 could indicate a potentially over bought stock. A few indicators you can look at to add in your charting are the MACD or Moving Average Convergence/Divergence, MFI or the Money Flow Index, or the STOCH, which indicates the Stochastic.
Building efficient market-beating portfolios requires time, education, and a lot of computing power!
The Portfolio Architect is an AI-driven system that provides multiple benefits to our users by leveraging cutting-edge machine learning algorithms, statistical analysis, and predictive modeling to automate the process of asset selection and portfolio construction, saving time and reducing human error for individual and institutional investors.
Try AI Portfolio ArchitectEditorial Staff
This story should be regarded as informational only and should not be considered a solicitation to sell or buy any financial products. Macroaxis does not express any opinion as to the present or future value of any investments referred to in this post. This post may not be reproduced without the consent of Macroaxis LLC. Please refer to our Terms of Use for any information regarding our disclosure principles.
Would you like to provide feedback on the content of this article?
You can get in touch with us directly or send us a quick note via email to editors@macroaxis.comDid you try this?
Run Portfolio Suggestion Now
Portfolio SuggestionGet suggestions outside of your existing asset allocation including your own model portfolios |
| All Next | Launch Module |
Check out Investing Opportunities to better understand how to build diversified portfolios. Also, note that the market value of any private could be tightly coupled with the direction of predictive economic indicators such as signals in estimate. You can also try the Sync Your Broker module to sync your existing holdings, watchlists, positions or portfolios from thousands of online brokerage services, banks, investment account aggregators and robo-advisors..
Other Consideration for investing
| Piotroski F Score Get Piotroski F Score based on the binary analysis strategy of nine different fundamentals | |
| Commodity Directory Find actively traded commodities issued by global exchanges | |
| Portfolio Anywhere Track or share privately all of your investments from the convenience of any device | |
| Alpha Finder Use alpha and beta coefficients to find investment opportunities after accounting for the risk | |
| Risk-Return Analysis View associations between returns expected from investment and the risk you assume | |
| Portfolio Dashboard Portfolio dashboard that provides centralized access to all your investments | |
| Equity Valuation Check real value of public entities based on technical and fundamental data | |
| Money Flow Index Determine momentum by analyzing Money Flow Index and other technical indicators | |
| Sign In To Macroaxis Sign in to explore Macroaxis' wealth optimization platform and fintech modules | |
| Portfolio Comparator Compare the composition, asset allocations and performance of any two portfolios in your account | |
| CEOs Directory Screen CEOs from public companies around the world | |
| Transaction History View history of all your transactions and understand their impact on performance |